Music Mirror
Client:
Role:
Lead Designer
Year:
2023
The Challenge
Process
Our team started the project by understanding the user's needs, and gathering feedback from users. We conducted extensive research on the real estate industry and competitors' websites to identify best practices and trends.
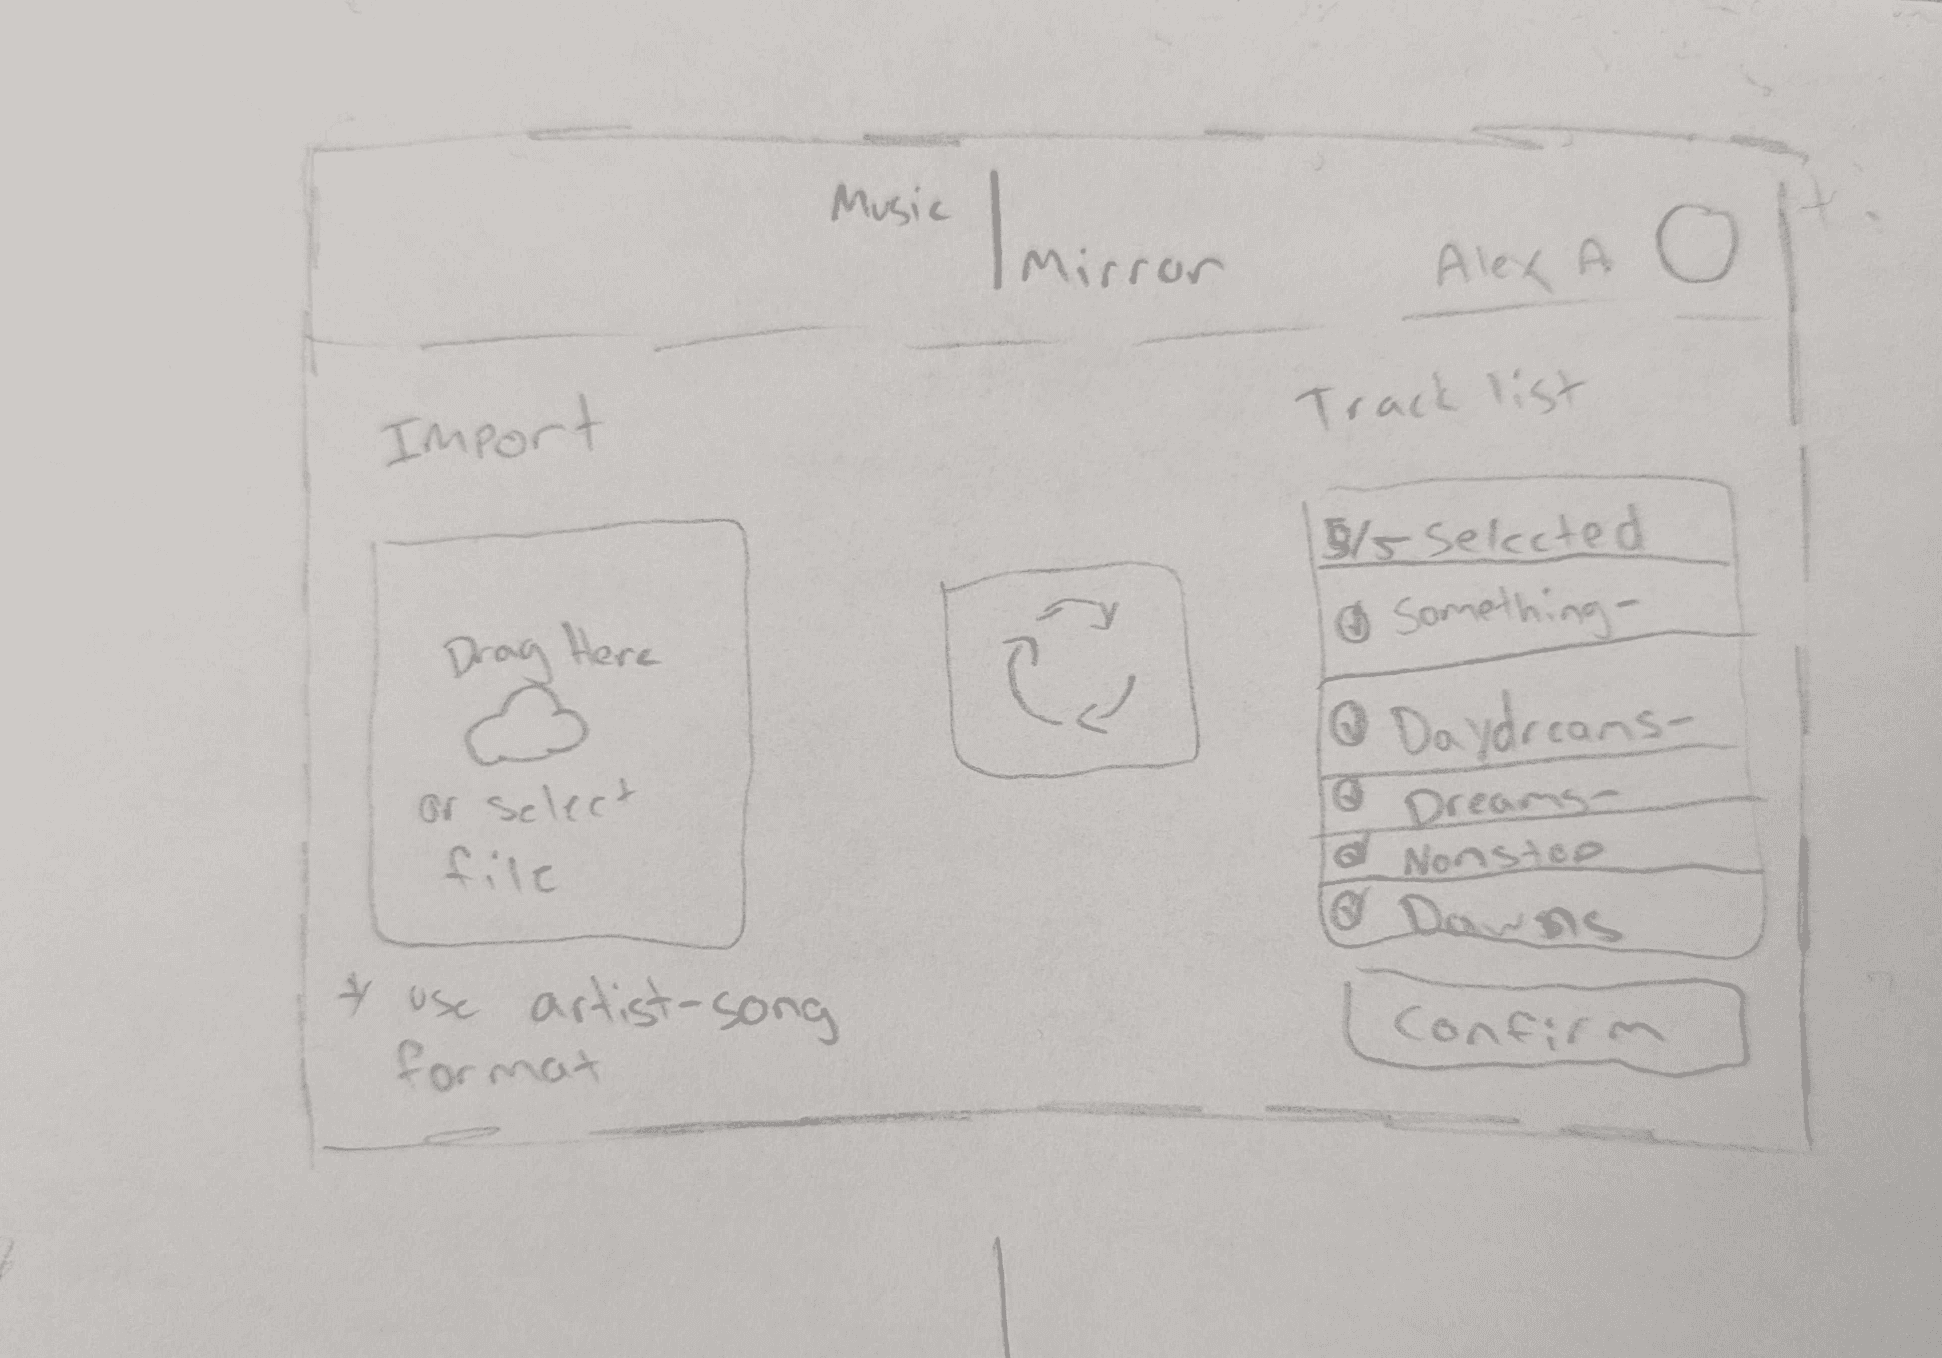
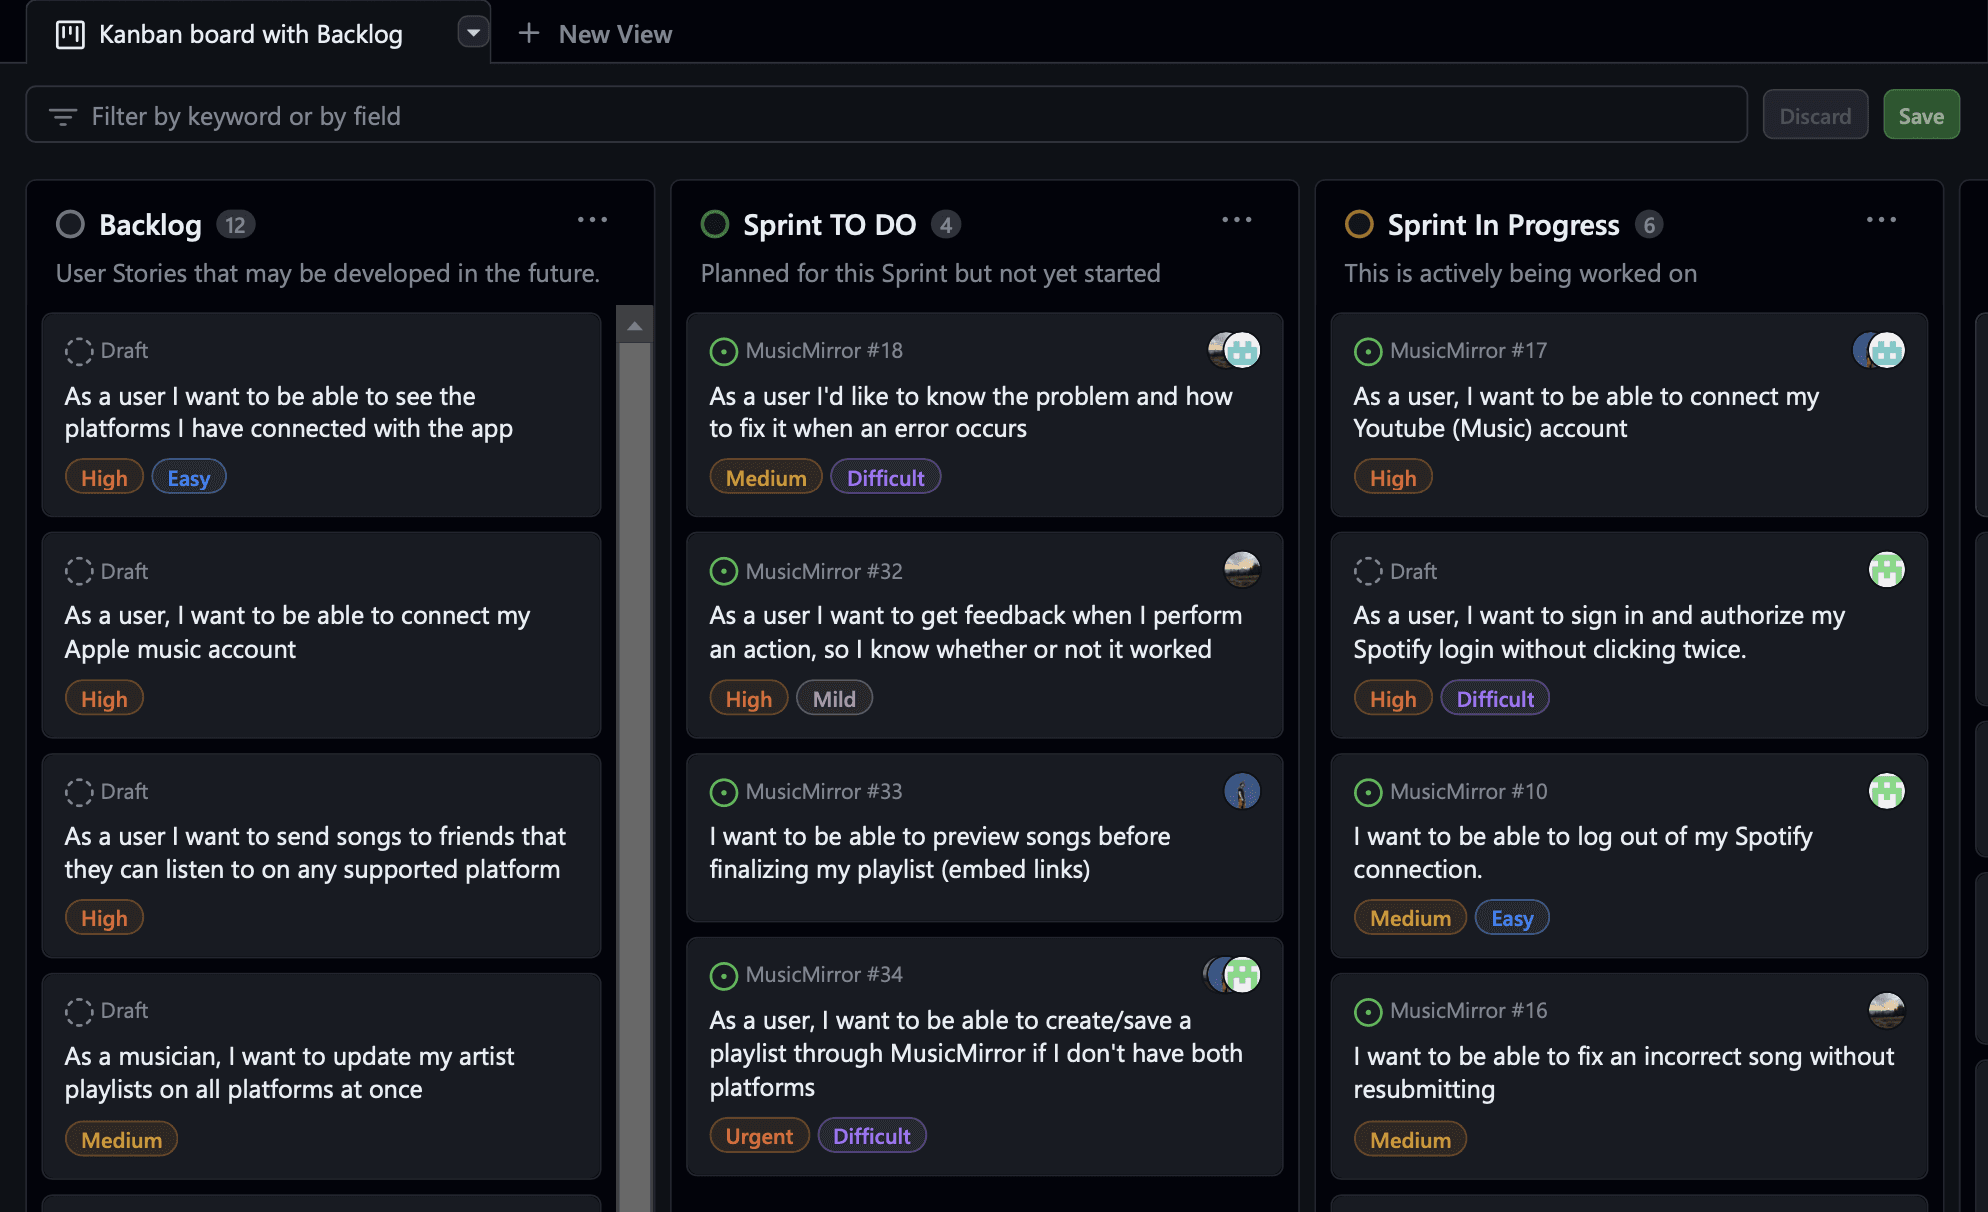
Low fidelity wireframes
User interviews & research
Synthesis the findings
Ideating the solution
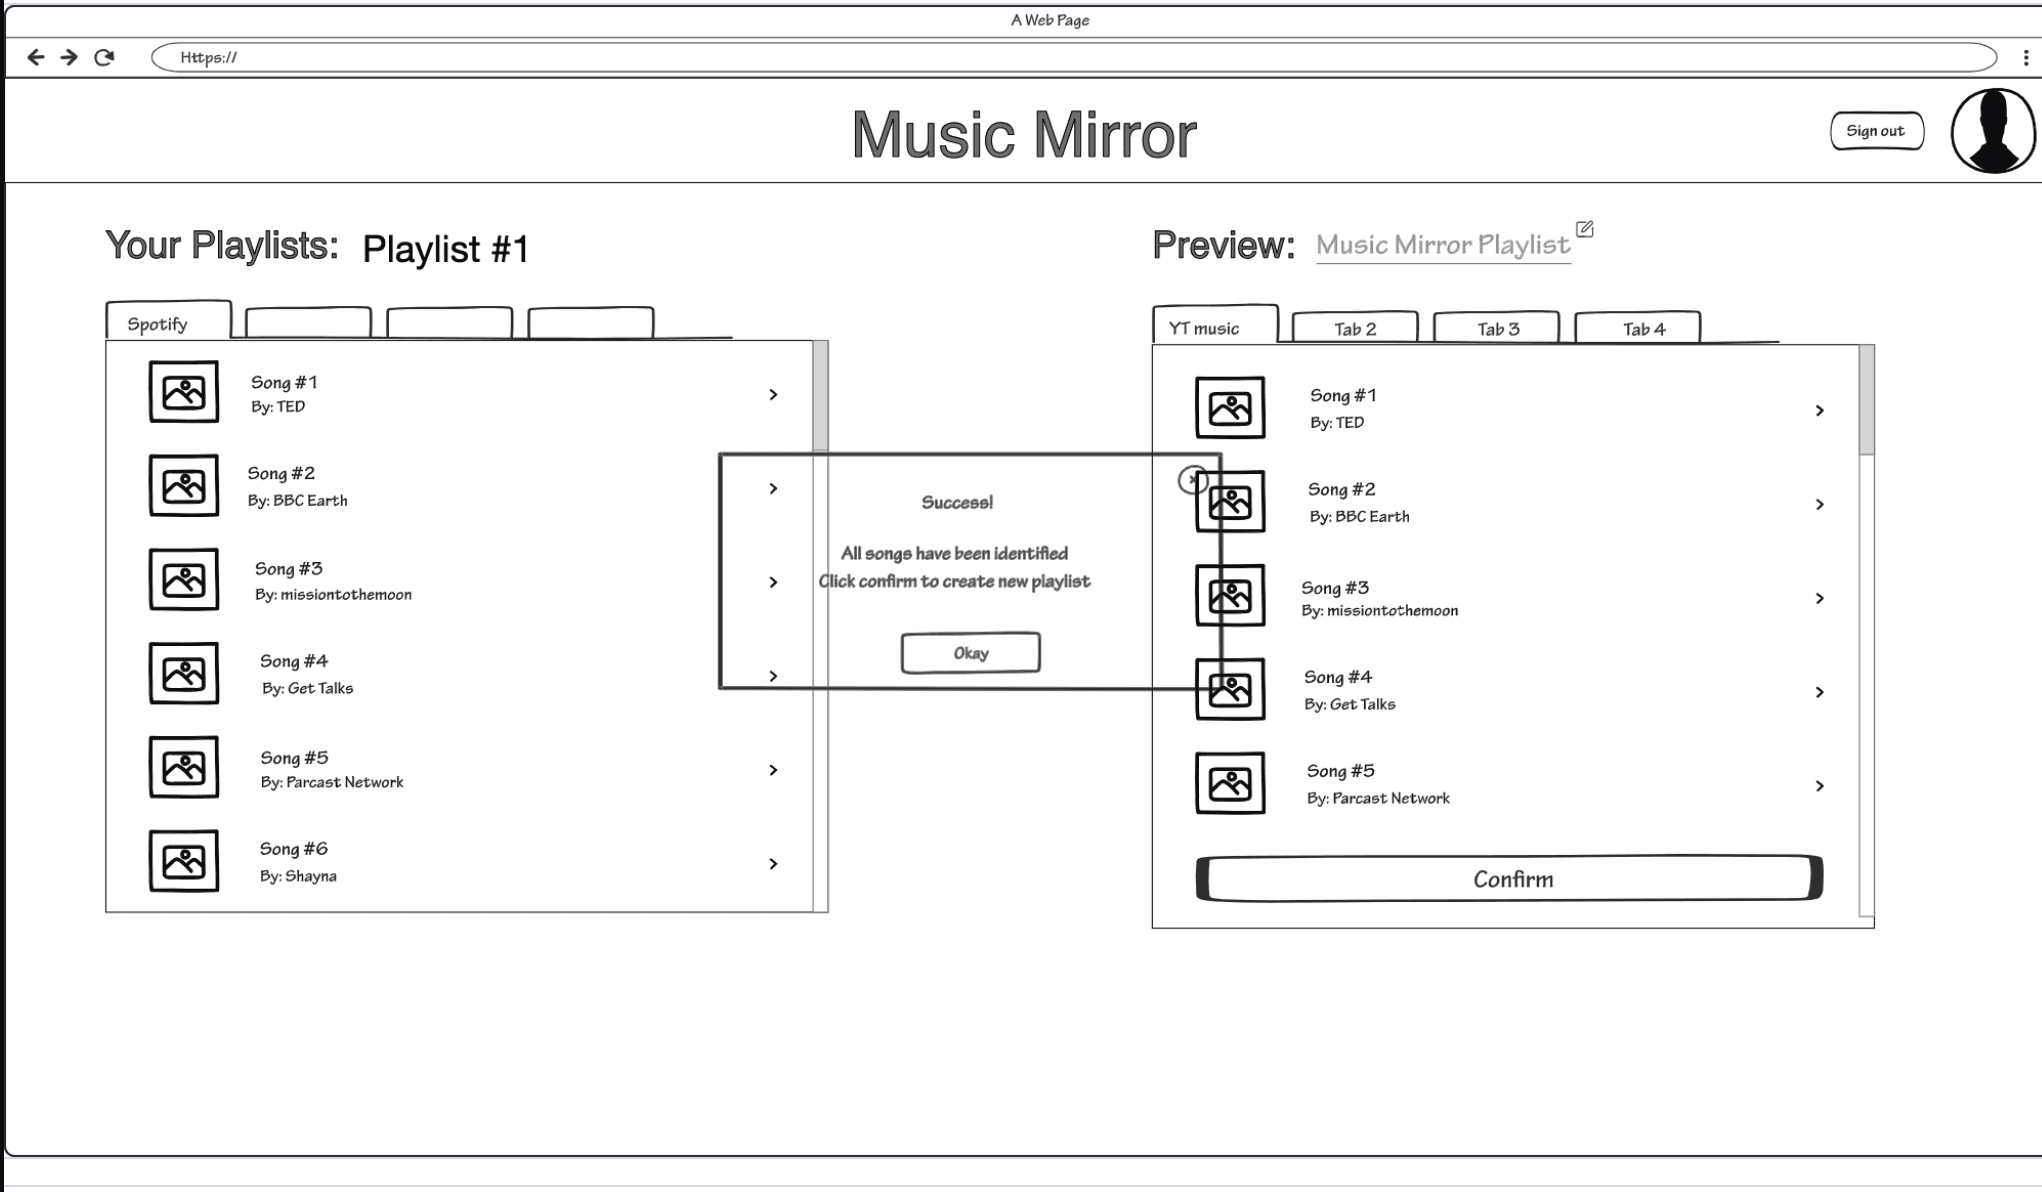
Craft a prototype with the main idea
Test with users to validate the idea
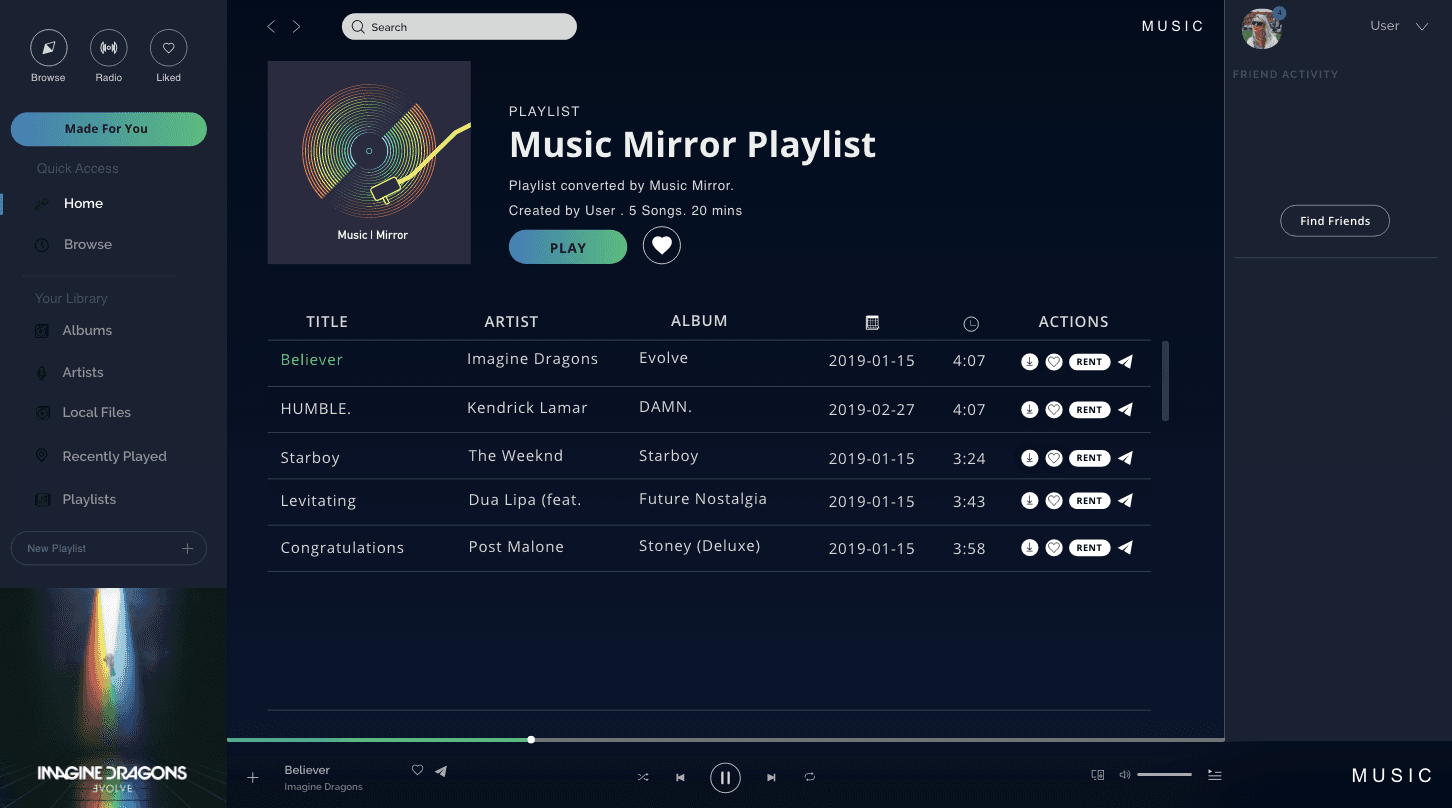
Solution
For our methods, we focused on user testing and user insights of our product. Users were provided with an Interactive prototype to provide functionality feedback. The structure of user testing was maintained by a task-based protocol.
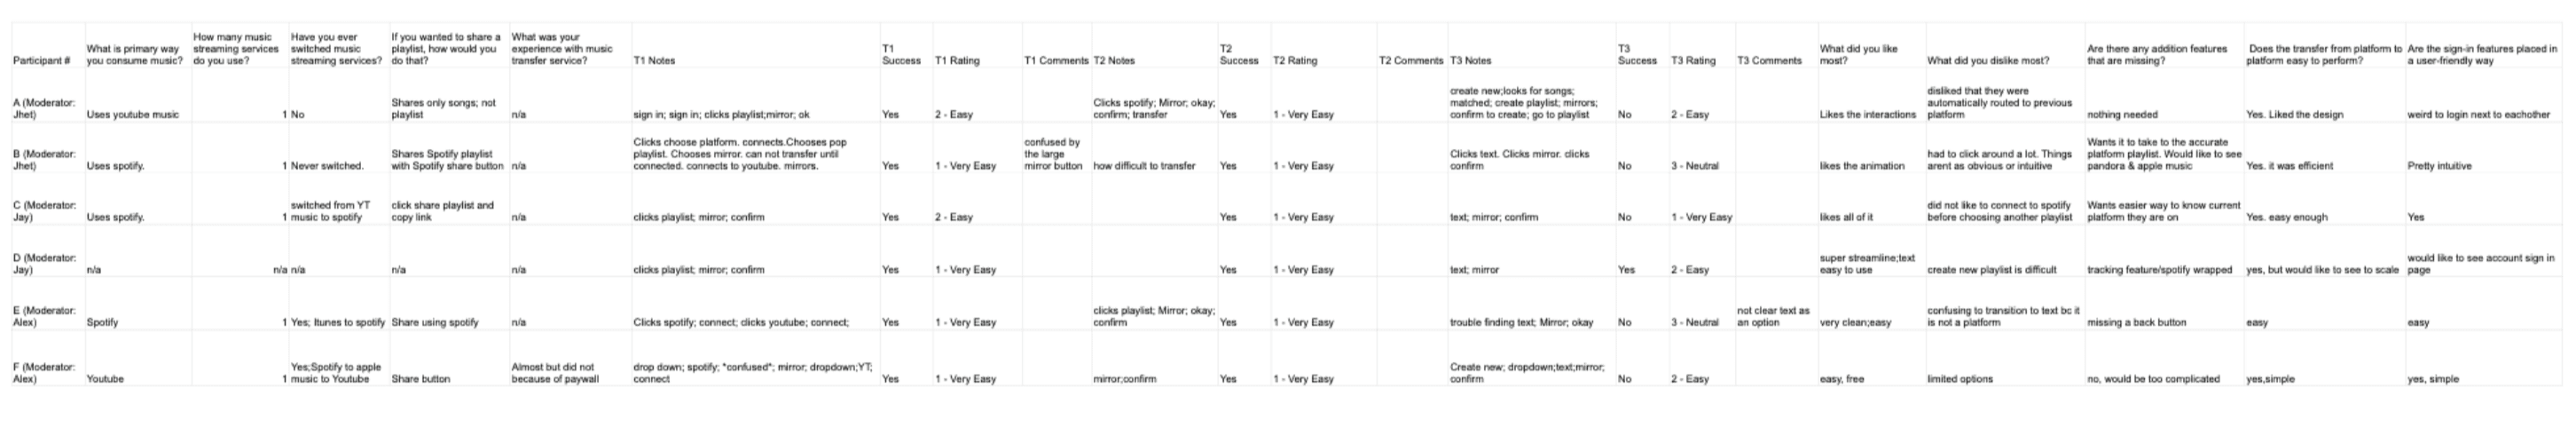
Our participants (n = 6) were first asked for background information about their experience with music streaming platforms to establish baseline data about the participants and their experience and expectations about using the platform. The participants were asked to use "thinking out loud" as well as were asked to rate tasks from 1-5 with 1 being easy and 5 being difficult.
After the initial background questions, the participants were faced with the first task which was to sign into their streaming platform from our initial Music Mirror page. From there they were also asked to sign into the secondary streaming platform that they would like to transfer their songs to. After this initial task was completed the participants were then asked to note the order of actions as well as voice concerns or errors they came across. After recording the data of their first task they were asked to score the test based on the level of difficulty from 1 being very easy to 5 being very difficult.
In the second task of the procedure, the participants were then asked to click the playlist that they wanted to transfer from one streaming platform to then copy the playlist to the secondary streaming platform. After the task was completed or not completed the participants would then be asked about the order of actions taken as well as mistakes made or if they were unsuccessful in completing the task. After the participants responded they would then be asked to rank the ask from 1-5 with 1 being the easiest and 5 being the most difficult.
In the third task of the procedure participants were asked to look at the list of papers with songs written on it and to use the Music Mirror platform to create a playlist on the platform. The participants were also asked to carefully look over the list of songs and artists to ensure that the list on the platform corresponded with what was written on the physical list. After the task was run, participants were asked follow-up questions about the task. Data was also recorded on the mistakes in completing the task and the ability to refine the list using Music Mirror. Last, the participants were asked to score the task difficulty from 1-5. the responses were then collected and put into a spreadsheet with data from all 3 tasks.
Key takeaways
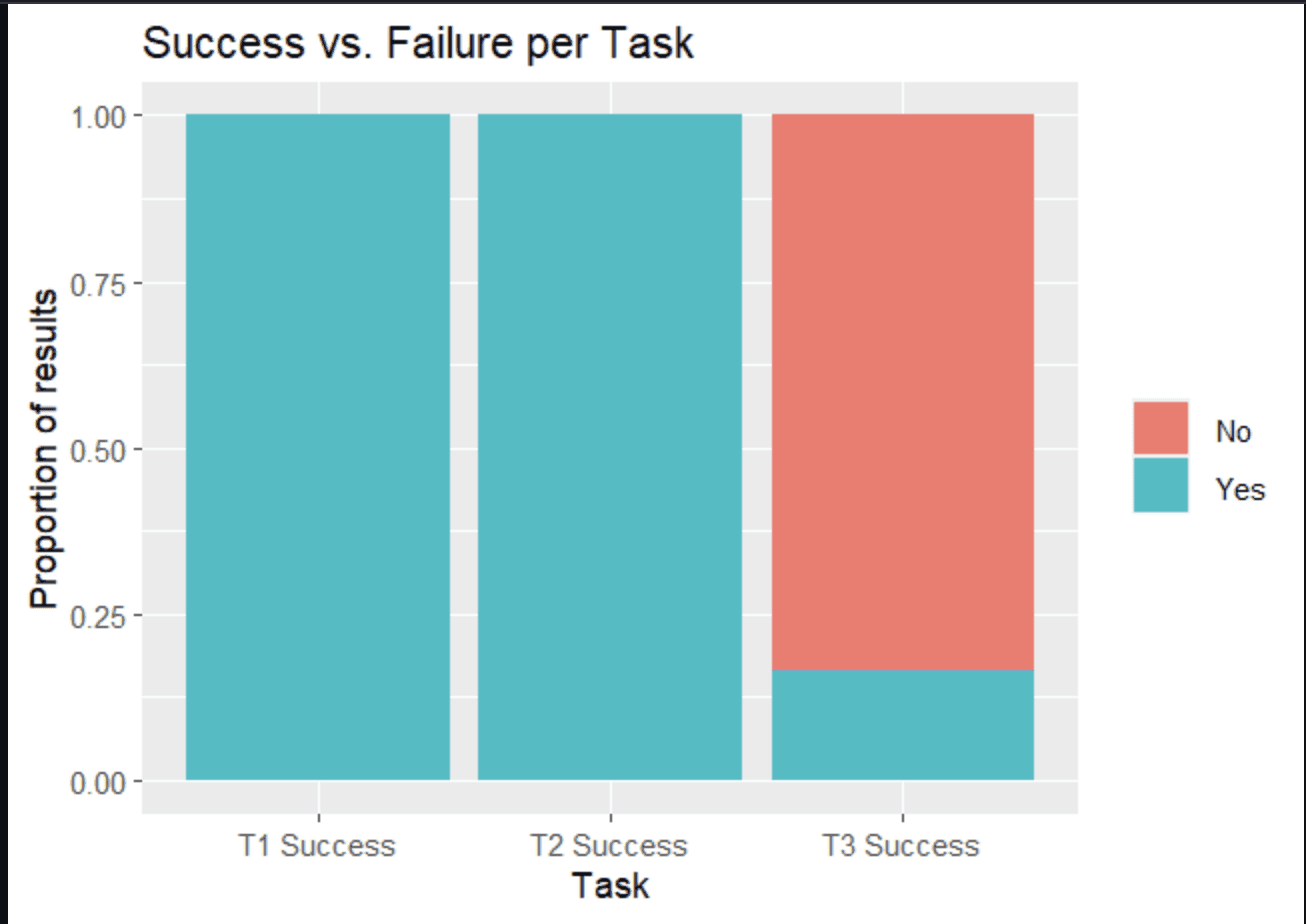
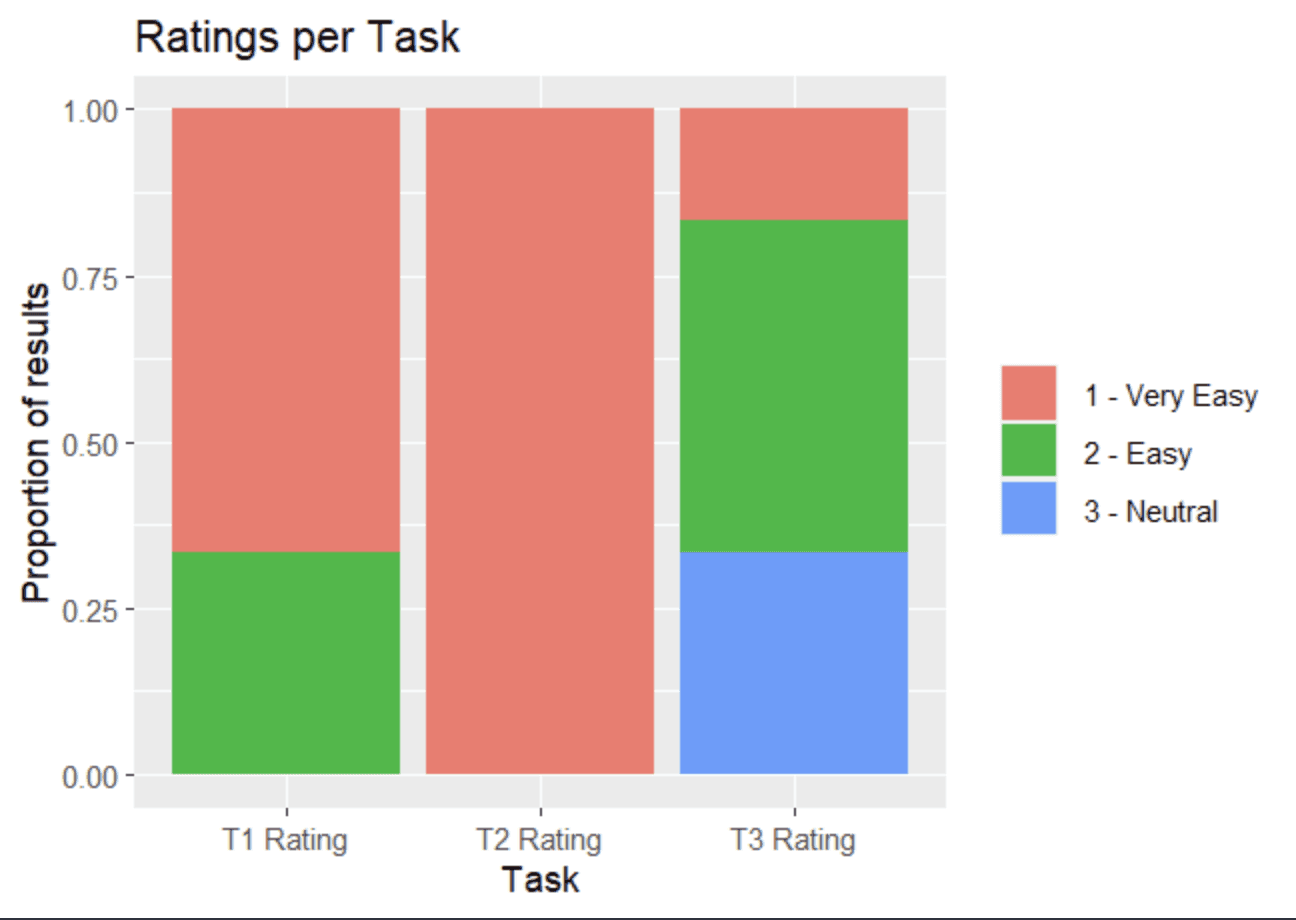
During our usability tests, we recorded data ranging from different variables that dealt with the amount of errors that occurred during each task as well as ratings given from each task based on how well features worked. Using the data we collected during the study we then turned the data into graphs that showed trends that accrued during the study. In the first graph, we compiled all the ratings of each initial task from each participant. Our findings showed that in the first task, people generally felt that completing task 1 was straightforward and there were no responses that conveyed that it was not possible to complete. Furthermore, in the first graph, we found that task 2 followed the same trend of task one with zero failures to complete the task as well as voting that it was very easy. In the third task, our results changed and through the data, it showed that most participants rated the task easy with a larger portion feeling that it was more difficult than the previous 2 tasks.
In the second set of data that was collected which was based on the completion rate of each task, we saw a change in trend from our first set of data. From this graph, the data shows that generally, all participants completed the first two tasks without any problems. Tasks 1 & 2 had 100% completion rates but, where we saw the biggest change was in task 3. From the data, we found that from task 2 to task 3 participants had a difficult time completing the tasks. Our graph shows that out of all the participants, only 1 participant was able to complete the task With task 3 having a 16.67% completion rate.